AZD: Pipeline metrics and agent pools
The Pipeline Metrics editor tab has two tabs: Pipeline, a dashboard of the runs in the repository, and Agents, the agent pools of the organization. For metrics about pull requests, see Pull request metrics.
Open the pipeline dashboard
Open pipeline metrics
Open the AZD Pipelines tool window.
In the title bar, click Pipeline Metrics.
The Pipeline Metrics editor tab opens on the Pipeline tab.
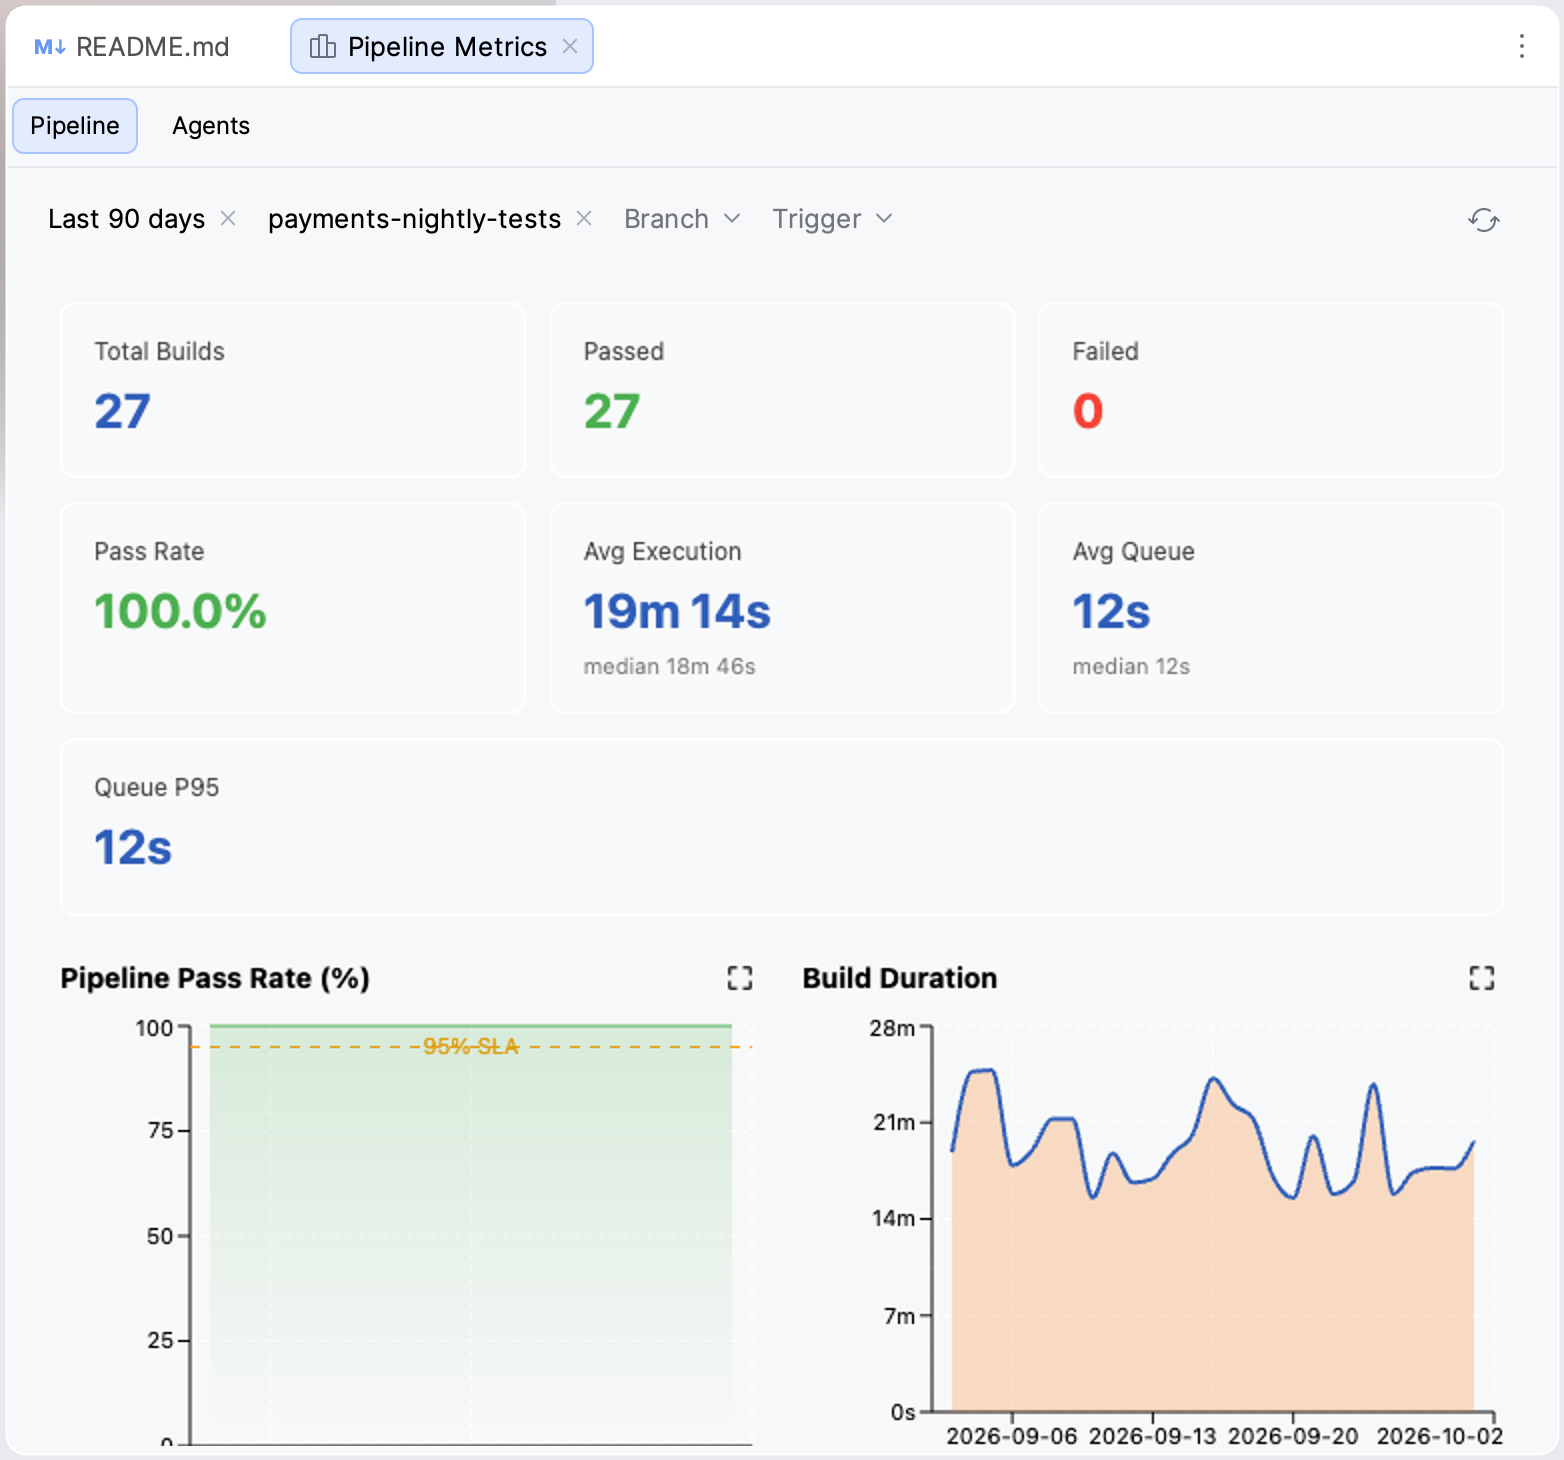
Narrow the data with the filters at the top: Time range, Pipeline, Branch and Trigger.
Time range offers Last 7 days, Last 30 days, Last 90 days, Last 6 months and Last year. Pipeline, Branch and Trigger accept several values; use All or Clear at the bottom of the popup. Click Refresh to reload the data.
Read the dashboard
The summary row shows:
- Total Builds, Passed, Failed
Number of runs in the selected range. Passed includes partially succeeded runs.
- Pass Rate
Share of runs that passed.
- Avg Execution
Average run time from start to finish, without queue time, with the median below.
- Avg Queue, Queue P95
Time runs waited for an agent: average and median, and the 95th percentile.
The widgets below show:
- Pipeline Pass Rate (%)
Pass rate over time.
- Build Duration
Run duration over time.
- Queue Time
Time spent waiting for an agent, over time.
- Top Failing Pipelines
Pipelines with the most failures. Hidden when you filter on one pipeline.
- Top Failure Causes
The most frequent failure reasons in a sample of failed runs.
- Slowest Stages
Stages with the longest durations in a sample of runs.
- Trigger Distribution
How runs were started, for example by CI, by a pull request or manually.
To enlarge a widget, click its maximize button.
Agent pools
The Agents tab lists the agent pools of the organization with the total number of agents and how many are online, busy and offline.
Inspect an agent pool
In the Pipeline Metrics editor tab, select the Agents tab.
Select a pool to open it. The pool has three sub-tabs: Details, Agents and Jobs.
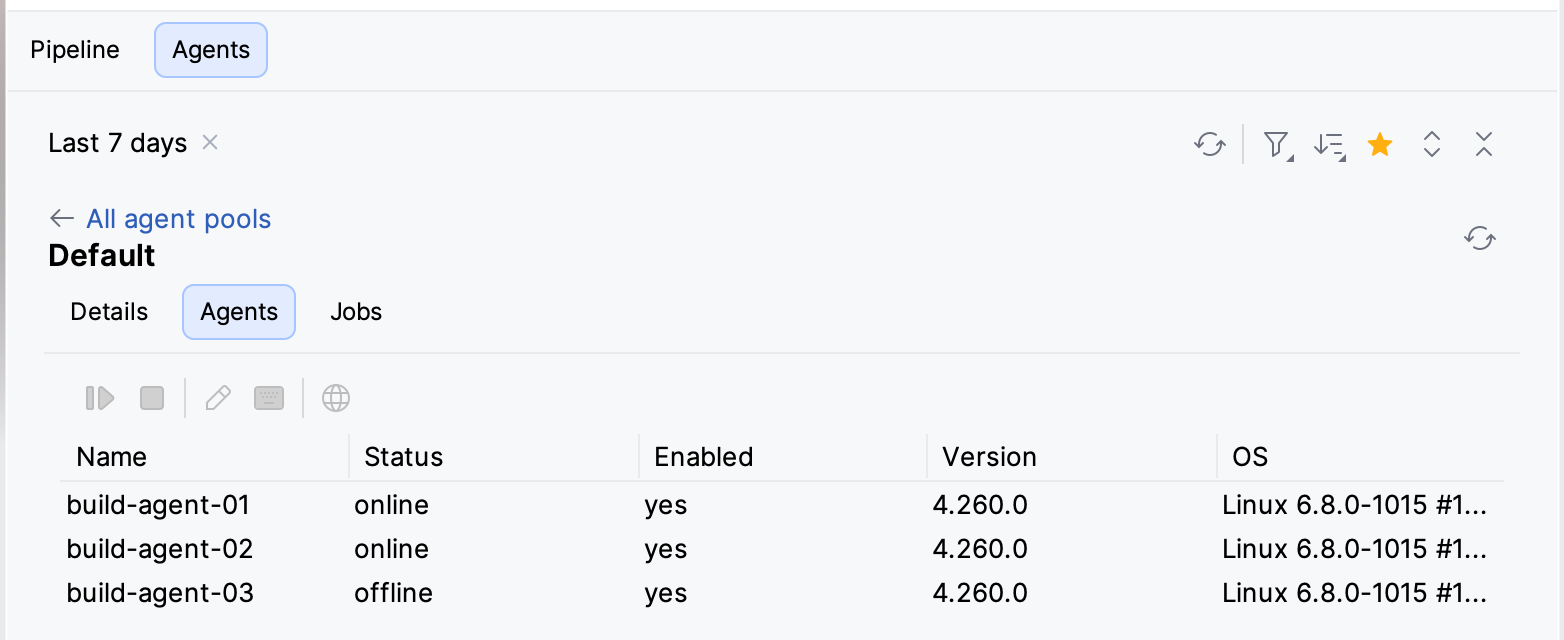
To narrow the pool list, click the filter icon and show pools by Type (Self-hosted or Microsoft-hosted) or by Status, or select Favorites Only. To sort it, click the sort icon and select Name, Total agents, Online, Busy or Offline.
Mark the pools you use often with Add to favorites, so that Favorites Only shows only those. Double-click an agent or a job row to open its run. The run opens in the AZD Pipelines tool window, or in the browser if Open AZD links in tool window is off.
Manage agents
On the Agents sub-tab, select an agent and use the toolbar. These actions need the Manage permission on the pool; without it, the buttons stay disabled.
- Enable
The agent picks up new jobs again.
- Disable for Maintenance
The agent finishes its current job and then takes no new work.
- Rename…
Changes the agent name.
- Edit Capabilities…
Adds, edits or removes user-defined capabilities.
- Open in Browser
Opens the agent on Azure DevOps.
If the dashboard is blank
The dashboard uses the IDE built-in browser (JCEF). If JCEF is not available, the tab shows a message instead of the charts. See A view shows a message instead of content.