GBrowser: DevTools and device emulation
GBrowser includes the developer tools of Chromium and a device toolbar similar to the one in Chrome. Use them to inspect the page you are working on and to check how it looks on smaller screens.
The default shortcuts in this topic are for Windows and Linux. On macOS, GBrowser shortcuts use ⌘ instead of Ctrl and ⌥ instead of Alt; see Default shortcuts on macOS.
Open DevTools
Inspect the current page
Load a page in GBrowser first; the action is not available for an empty tab.
Press F12.
Click More Options and select Open DevTools.
Right-click the page and select Open DevTools.
Chromium DevTools opens in a separate window, with the Elements, Console, Network and other panels for the page in the current tab.
Emulate a mobile device
Turn on device emulation
Click More Options and select Emulate Mobile Device Viewport and User Agent, or press Ctrl+Shift+M. A device toolbar appears above the page, and the page is shown in a frame of the selected size. In the keymap, the action is named Toggle Device Emulation.
In the device list, keep Responsive or select a device. Responsive starts at 400 × 626 pixels.
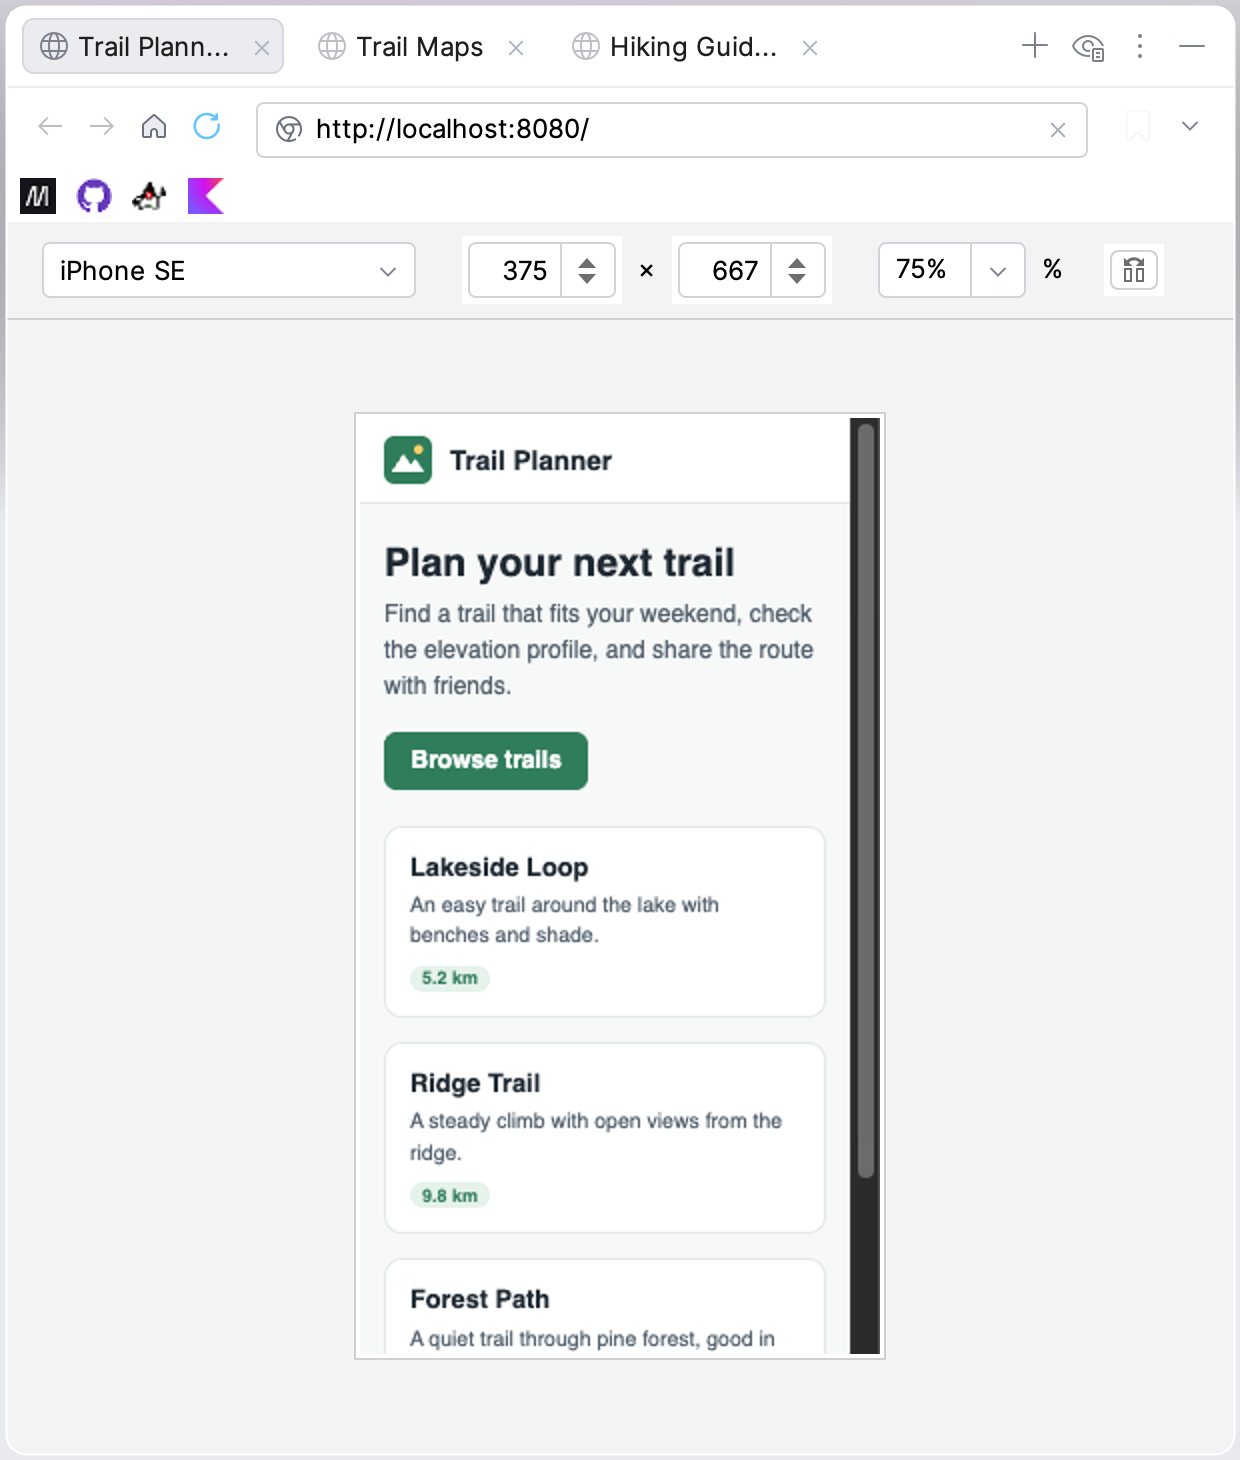
Optional: change the width and height in the two number fields, select a zoom level, or click Rotate to swap the width and height.
When you select a device, GBrowser resizes the page frame to the device's screen size and reloads the page. GBrowser also tries to report the device's user agent to scripts on the page, but requests to the server keep GBrowser's own User-Agent header, so server-side mobile detection does not see the emulated device. Width and height accept values from 50 to 9999 pixels. The zoom list offers 50% to 150%, and you can type another value. If the frame is larger than the tool window, GBrowser scales the page down to fit.
Device emulation applies to the current tab only and is not saved. While it is on, the menu item shows the device name, for example Device: iPhone SE. To turn emulation off, select that item again or press Ctrl+Shift+M. GBrowser then shows the page at the full size of the tool window again, resets the zoom to 100% and reloads the page.
Available devices
The device list contains Responsive and these profiles:
iPhone SE
iPhone XR
iPhone 12 Pro
iPhone 14 Pro Max
Pixel 7
Samsung Galaxy S8+
Samsung Galaxy S20 Ultra
iPad Mini
iPad Air
iPad Pro
Surface Pro 7
Surface Duo
Galaxy Z Fold 5
Asus Zenbook Fold
Samsung Galaxy A51/71
Nest Hub
Nest Hub Max
Debug from Chrome through a port
You can also attach desktop Chrome to the IDE's embedded browser and inspect GBrowser pages from there. The port applies to every embedded browser in the IDE, not only to GBrowser.
Set the debugging port
Open the Settings dialog (Ctrl+Alt+S, macOS: ⌘ ,) and select .
Under Developer Options, select Debug port and enter the port number. The default is 9222.
Click OK and restart the IDE.
In Chrome, open
chrome://inspect.Click Configure and add
localhost:followed by your port number, for examplelocalhost:9222.Under Remote Target, click inspect next to a page that is open in the IDE.