AZD: Work with pipelines
The AZD Pipelines tool window lists the pipeline runs of the current repository and opens each run in its own tab. For the YAML schema, approvals and Node.js options, see Pipeline Settings.
Find a pipeline run
The tool window is available in projects with an Azure DevOps Git remote. If you are not signed in, it shows the sign-in options; see Connect to Azure DevOps. The first tab, named after the repository, lists the runs of every pipeline in that repository, newest first. Each row shows the run name, commit message, branch, result and the person who requested the run.
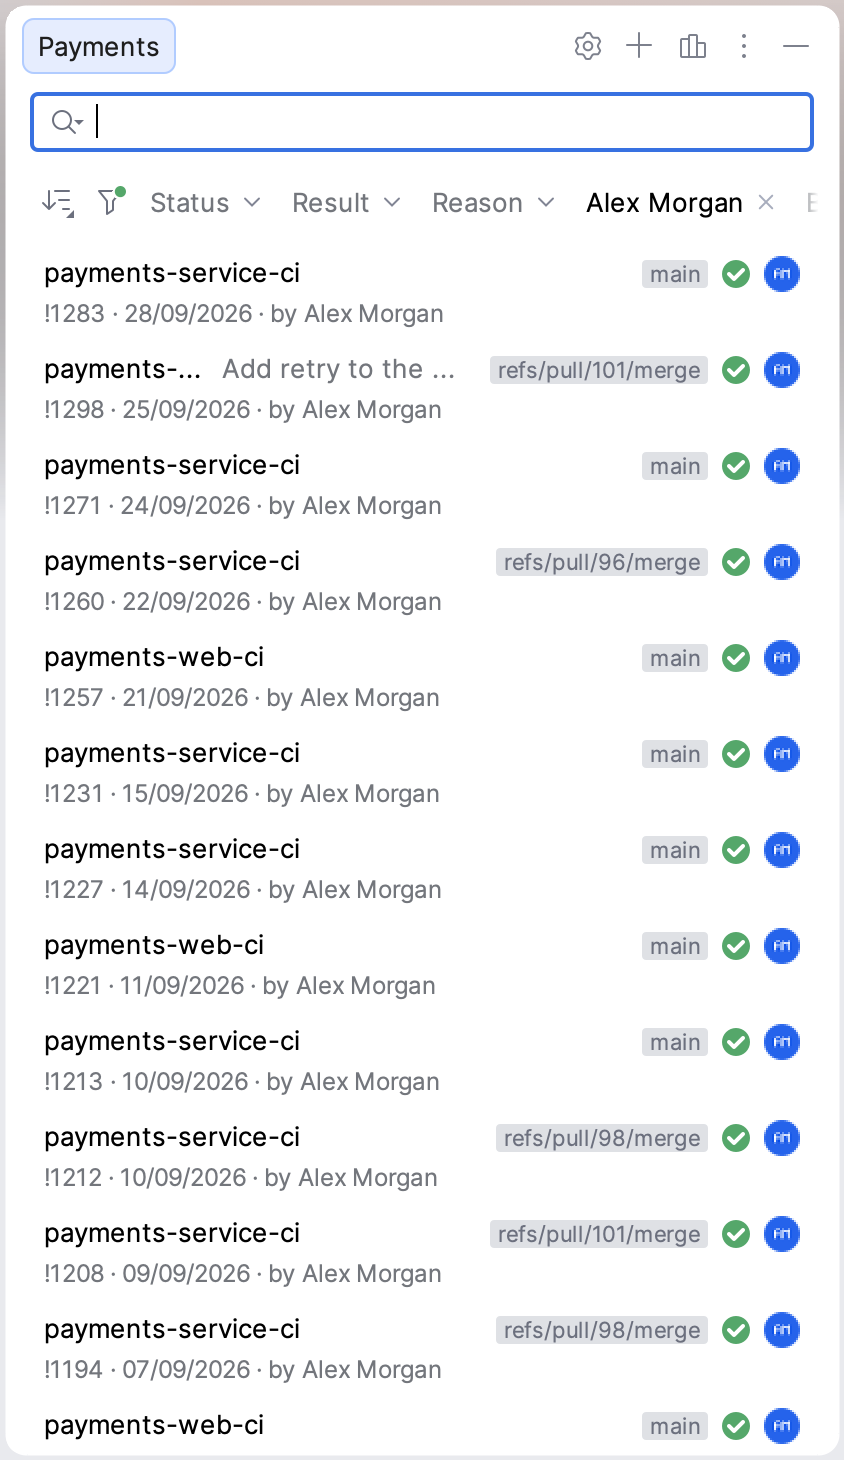
Find and open a run
Type in the search field, or click the filter icon and select a quick filter: All, In Progress, Triggered by me or Current branch.
Narrow the list with the filter chips: Status, Result, Reason, Triggered by, Branch and Pipeline Name. Pipeline Name accepts several pipelines.
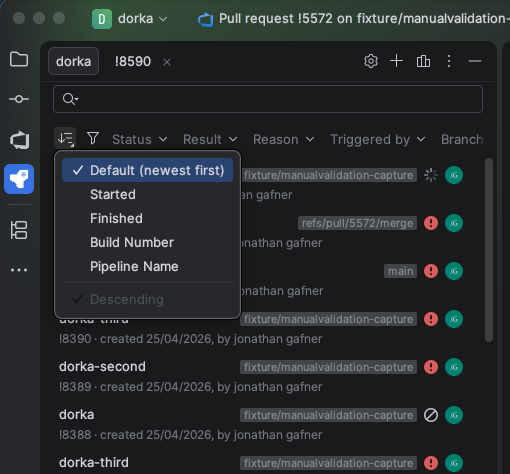
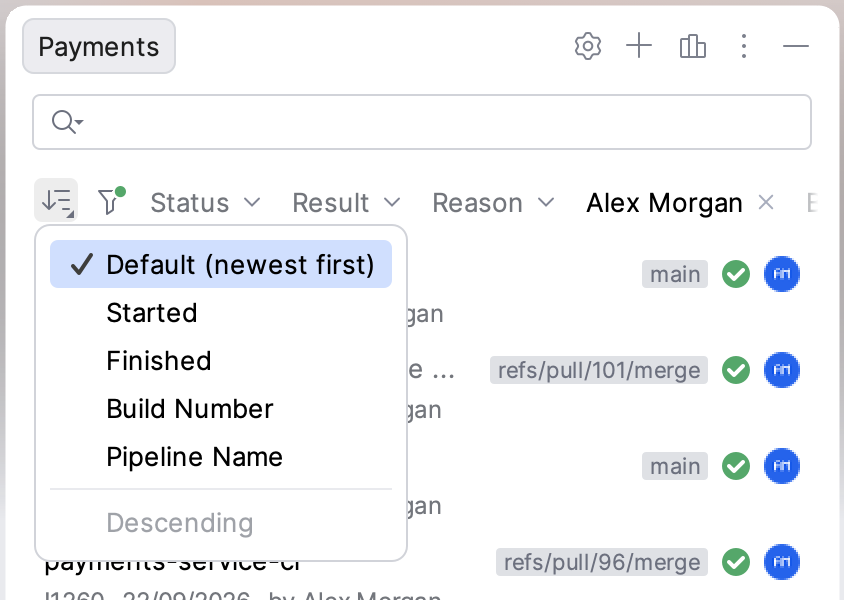
To change the order, click the sort icon and select Default (newest first), Started, Finished, Build Number or Pipeline Name. Select Descending to reverse it.
Double-click a run, or right-click it and select Show Pipeline Details, to open it in a new tab.
The context menu of a run also has these actions:
- Open Pipeline in Browser
Opens the run on Azure DevOps.
- Copy Pipeline URL
Copies the web URL of the run.
- Filter by This Pipeline
Shows only the runs of the same pipeline.
- Refresh Builds List
Reloads the list.
To refresh the list on a schedule, select Auto-refresh pipelines in Preferences.
Run a pipeline
Queue a pipeline run
In the AZD Pipelines title bar, click Run Pipeline (the + icon), or press Alt+Insert (macOS: ⌘ N) while the tool window has focus.
The Run Pipeline tab opens.
In Pipeline, start typing the pipeline name and select it.
In Branch, select the branch to build. If the branch does not exist, the pipeline uses its default branch.
Under Pipeline parameters, set the runtime parameters the pipeline defines.
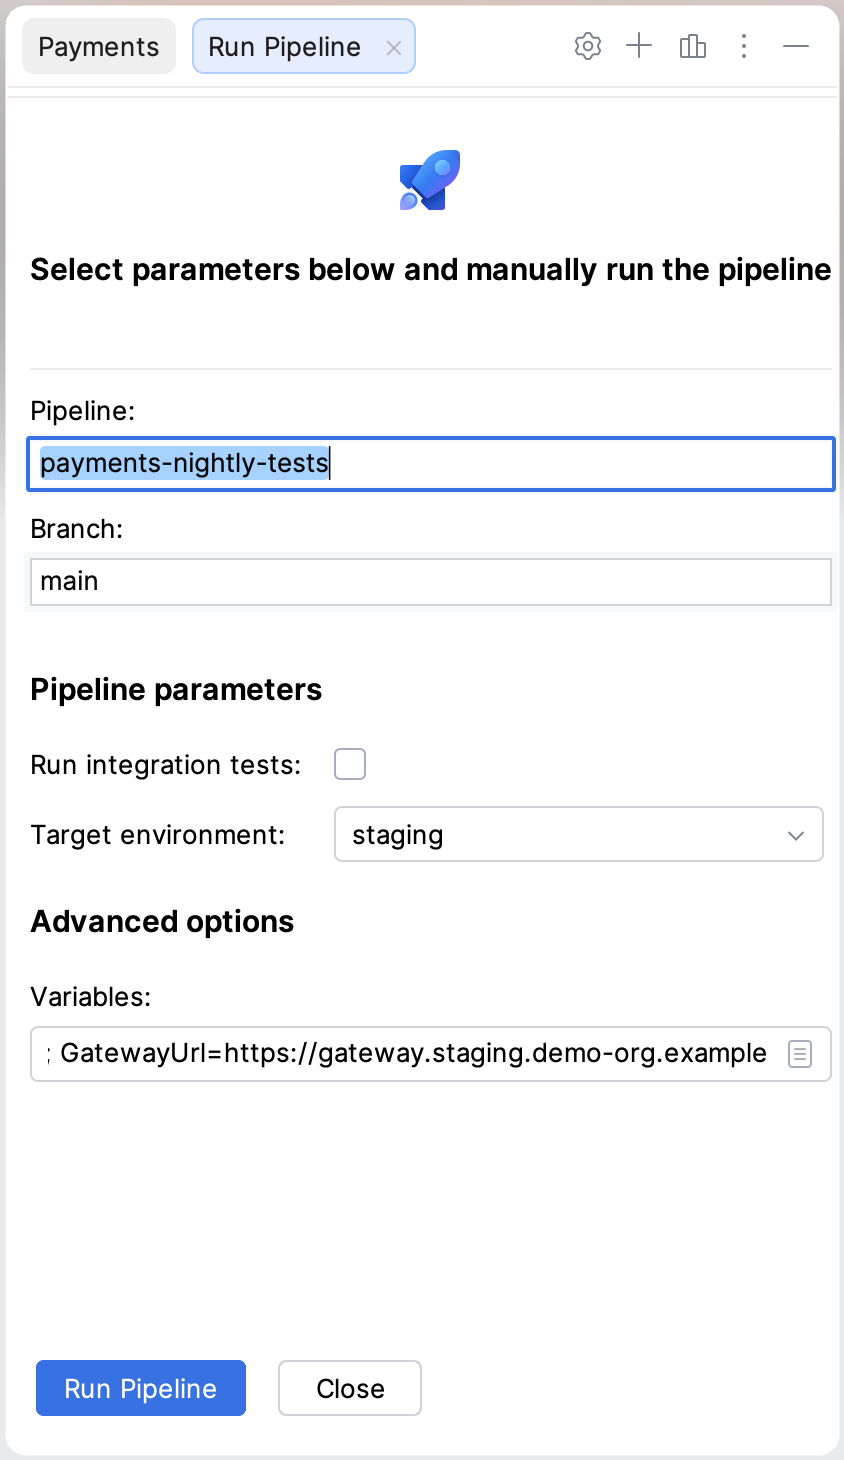
Optional: if the pipeline has variables that can be set at queue time, click the browse button in Variables under Advanced options to edit them in the Pipeline Variables dialog.
Click Run Pipeline.
AZD queues the run and opens it in a new tab.
To queue an open run again, see Inspect a run.
Inspect a run
A run tab shows:
The run number and a status label, such as SUCCESS, FAILED or IN PROGRESS.
Repository and version: links to the repository, the commit and, for runs started by a pull request or by its merge, the pull request. A pull request of this repository opens in the AZD Pull Requests tool window if Open AZD links in tool window is selected; the other links open in the browser.
Time started and elapsed, and how long the run waited for an agent.
The stage, job and task tree with live durations. A run that was rerun shows an Attempt #n node for each attempt, and the latest one is marked (latest).
Right-click a stage, job or task in the tree for these actions:
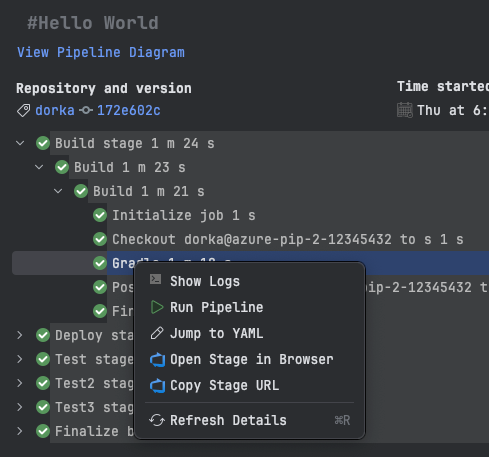
- Show Logs
Opens the log of the task in the editor. See View stage logs.
- Run Pipeline
Opens the Run Pipeline tab with the pipeline and branch of this run filled in.
- Jump to YAML
Opens the pipeline definition file.
- Open Stage in Browser
Opens the selected stage, job or task on Azure DevOps.
- Copy Stage URL
Copies its web URL.
- Refresh Details
Reloads the run.
Cancel a run or rerun failed jobs
The button at the bottom of the run tab changes with the state of the run.
To stop a running pipeline, click Cancel. The button shows Cancelling… until Azure DevOps stops the run.
To rerun the failed jobs of a finished run, click Rerun failed jobs, then click Yes to confirm.
View stage logs
Double-click a task in the run tree, or right-click it and select Show Logs. The log opens in an editor tab named <task> logs and loads one page at a time.
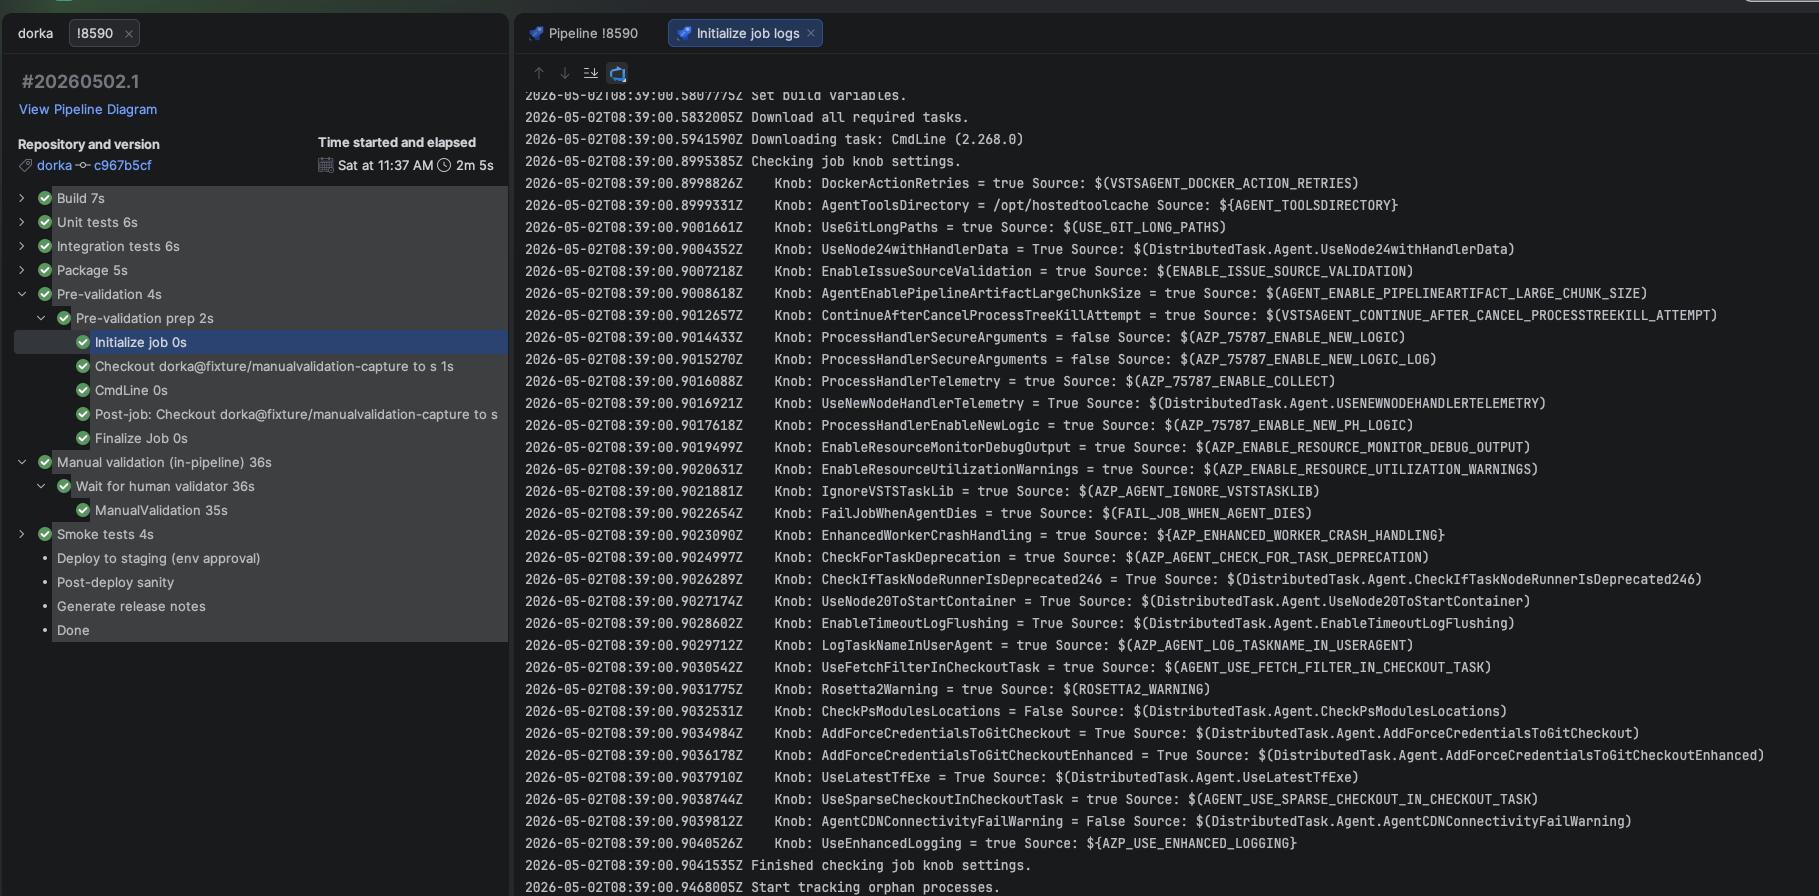
- Earlier Lines
Shows the previous page of the log.
- Later Lines
Shows the next page.
- Jump to End
Shows the end of the log.
- Chat with AI About This Log
Sends the log to an AI provider. See Analyze a log with AI.
The status line shows which lines are on screen, for example Showing lines 1–3000 of 8200. A page holds 3000 lines by default; change it with the azd.pipeline.log.page.lines registry key. Sections that the pipeline marks with ##[group] are folded under their group name; click the fold to expand one.
Analyze a log with AI
Ask an AI provider to explain a failure and suggest a fix, then ask follow-up questions about the same log.
Analyze a stage log with AI
Open the log of a task, as described in View stage logs.
In the log toolbar, click Chat with AI About This Log and select a provider.
Read the analysis in the new AI Log tab of the AZD Pipelines tool window.
Optional: type a question in Ask a follow-up about this log and click Send. Click Stop to cancel an answer.
The list shows the providers enabled in . To add a provider or switch it off, see AI providers.
View the stage diagram
In a run tab, click View Pipeline Diagram. The Pipeline !<id> editor tab opens on the Stages tab with a graph of the stages and their dependencies. The graph updates while the run is in progress.
Click a stage to show or hide its jobs.
Drag a stage to move it.
Use the toolbar to Change Layout, Zoom In, Fit to Screen, Zoom Out, Open Pipeline in Browser, Copy Pipeline URL or Refresh Details.
The Tests tab shows the test results of the run; see AZD: Review pipeline test results.
To rerun the failed jobs of a run, click Rerun failed jobs at the bottom of the run tab; see Cancel a run or rerun failed jobs.
Approvals, tests, metrics and YAML
To approve, reject or defer a run that waits for you, see AZD: Approve pipeline runs.
To review test results and associate tests with test cases, see AZD: Review pipeline test results.
To see pass rates, durations, queue times and agent pools, see AZD: Pipeline metrics and agent pools.
For completion and validation in azure-pipelines.yml and other pipeline files, see AZD: Edit Azure Pipelines YAML.
Keyboard shortcuts
These shortcuts work while the AZD Pipelines tool window has focus.
Action | Windows and Linux | macOS |
|---|---|---|
Open AZD Pipelines Settings | Ctrl+Alt+S | ⌘ , |
Run Pipeline | Alt+Insert | ⌘ N |
Refresh Builds List and Refresh Details use the IDE Refresh shortcut. To see or change it, open .